

AI agents are transforming enterprise applications across industries, from customer service to complex decision workflows. As organizations scale these deployments, they face a fundamental question: how can you improve trust in an AI application? The challenge is transparency. AI agents can make decisions on behalf of users, invoke tools dynamically, and follow reasoning paths that create an accountability gap. Having visibility into the factors influencing user interactions and outcome can help you build transparent and reliable agents.Too often, observability becomes an afterthought. This approach fails with AI agents. Observability must be fundamental from day one because these systems learn, adapt, and make decisions that directly impact user trust. Early observability implementation helps you build transparency, reliability, and exceptional user experiences as core features.
At the AWS Summit New York City 2025, we introduced Amazon Bedrock AgentCore Observability, a comprehensive monitoring solution for AI agents that works across different agent frameworks and foundation models (FMs). Amazon Bedrock AgentCore Observability makes it straightforward for developers to monitor, analyze, and audit AI agent interactions by minimizing complex observability infrastructure setup while providing full visibility into agent operations. It provides powerful capabilities for tracking agent interactions, analyzing performance metrics, and debugging issues across different deployment environments, so developers can build trustworthy AI systems from day one.
In this post, we walk you through implementation options for both agents hosted on Amazon Bedrock AgentCore Runtime and agents hosted on other services like Amazon Elastic Compute Cloud (Amazon EC2), Amazon Elastic Kubernetes Service (Amazon EKS), AWS Lambda, or alternative cloud providers. We also share best practices for incorporating observability throughout the development lifecycle.
The following video provides an overview of the capabilities, showcases the dashboard interface, and highlights how these features integrate with your agent development workflow. To quickly get started, visit our GitHub repo for a code walkthrough and to learn more.
Solution overview
Amazon Bedrock AgentCore Observability is designed as a development accelerator that delivers immediate value from day one with the following key benefits:
- Ease of setup and usage
- Full end-to-end traceability and visualization with readily available dashboards
- Standardized for OpenTelemetry and generative AI semantic conventions
- Can be used with all AI agent frameworks and large language models (LLMs)
This unified monitoring approach reduces the need for framework-specific observability solutions, simplifying implementation across diverse agent architectures. This flexibility helps make your observability investment valuable regardless of your technology choices.Amazon Bedrock AgentCore Observability offers two ways to configure monitoring to match different infrastructure needs:
- Amazon Bedrock AgentCore Runtime-hosted agents – These agents are deployed and executed directly within the Amazon Bedrock AgentCore environment, providing automatic instrumentation with minimal configuration. This approach offers the fastest path to deployment and is ideal for rapid development and testing.
- Non-runtime hosted agents – These agents deliver the same monitoring capabilities for agents deployed on your own infrastructure, for consistent observability regardless of where your agents run.
Both options capture critical metrics that traditional monitoring misses, including token usage, tool selection patterns, reasoning processes, and end-to-end latency across agent workflows. Data is automatically routed to Amazon CloudWatch and accessible through the GenAI Observability dashboard’s Bedrock AgentCore tab, making it straightforward to identify patterns and troubleshoot issues. Teams typically see reduced debugging time, lower production incident rates, and more efficient resource utilization across their AI agent deployments.
Prerequisites
To enable Amazon Bedrock AgentCore Observability for your AI agents, you must have the following prerequisites:
- An active AWS account with model access enabled to the FM you want to use and credentials configured.
- Transaction search enabled on CloudWatch. First-time users must enable CloudWatch transaction search to view Amazon Bedrock AgentCore spans and traces.
- The OpenTelemetry library. To add it, include
aws-opentelemetry-distro(ADOT) in yourrequirements.txtfile.
For agents hosted on Amazon Bedrock AgentCore Runtime, observability is automatically enabled with no additional configurations. For agents not hosted on Amazon Bedrock AgentCore Runtime, you must create a log group and log stream for your agent in CloudWatch, which you can use to configure the following environment variables:
AGENT_OBSERVABILITY_ENABLED=true– Activates the ADOT pipelineOTEL_PYTHON_DISTRO=aws_distro– Uses AWS Distro for OpenTelemetryOTEL_PYTHON_CONFIGURATOR=aws_configurator– Sets the AWS configurator for ADOT SDKOTEL_EXPORTER_OTLP_PROTOCOL=http/protobuf– Configures the export protocolOTEL_EXPORTER_OTLP_LOGS_HEADERS=x-aws-log-group=<YOUR-LOG-GROUP>,x-aws-log-stream=<YOUR-LOG-STREAM>, andx-aws-metric-namespace=<YOUR-NAMESPACE> – Directs logs to CloudWatch groupsOTEL_RESOURCE_ATTRIBUTES=service.name=<YOUR-AGENT-NAME>– Identifies your agent in observability data
You can manage these environment variables using an .env file to keep AWS credentials separate from your code. For an example template, refer to the following env.example file.
Install dependencies
The implementation process requires enabling transaction search in your AWS account (a one-time setup) and including the necessary dependencies in your requirements.txt file:
With these dependencies installed and CloudWatch transaction search enabled, you’re ready to implement observability for your AI agents. The implementation process differs based on where your agents are hosted, but both approaches deliver the same comprehensive monitoring capabilities through the CloudWatch GenAI Observability dashboard.
Configure observability for agents on Amazon Bedrock AgentCore Runtime
Amazon Bedrock AgentCore Runtime provides the fastest path to comprehensive observability with automatic instrumentation built into your environment. Your existing agent code requires zero changes—you simply wrap it with the Amazon Bedrock AgentCore Runtime SDK to gain full observability. Amazon Bedrock AgentCore Runtime automatically captures session metrics, performance data, error tracking, and complete execution traces including all tool invocations.The following code shows how a standard agent becomes production-ready with automatic observability by adding just four lines of Amazon Bedrock AgentCore Runtime SDK code:
No instrumentation code, manual span creation, or further configuration is needed. The runtime automatically propagates trace context, correlates sessions, and captures detailed telemetry for the LLM calls, tool invocations, and decision points in your agent’s workflow.
Configure observability for agents outside Amazon Bedrock AgentCore Runtime
For agents running on Amazon EC2, Amazon EKS, Lambda, or other platforms, Amazon Bedrock AgentCore Observability delivers identical monitoring capabilities—the same metrics, traces, spans, and dashboard visualizations as runtime-hosted agents. The only difference is the initial setup: you configure environment variables to direct telemetry data to CloudWatch and run your agent with OpenTelemetry instrumentation. First, configure your environment variables to enable observability:
Then run your existing agent code with OpenTelemetry instrumentation:
The OpenTelemetry instrumentation automatically captures the same telemetry as the runtime approach—framework operations, LLM calls, tool invocations, and execution flows—without requiring additional code changes. This provides complete observability regardless of where your agents are deployed.
Add session tracking and custom attributes
Although both implementation paths provide comprehensive observability out of the box, you can enhance your telemetry with custom attributes for more granular analysis. Amazon Bedrock AgentCore Runtime handles session tracking automatically through the runtimeSessionId parameter, but you can add custom metadata using OpenTelemetry baggage for both runtime and non-runtime agents.
To add custom attributes that enhance filtering, analysis, and debugging, use the following code:
These custom attributes flow through your entire trace, enabling powerful queries in CloudWatch such as “show me all premium user sessions with latency over 2 seconds” or “compare performance between experiment versions.” This metadata becomes invaluable for offline evaluations, A/B testing, and performance optimization.
Implement advanced tracing with custom headers
For even deeper observability and cross-service correlation, you can enhance your agent invocations with custom headers. This is particularly useful when your agents interact with other services or when you need to maintain trace continuity across different components. See the following code:
With this configuration, your observability data flows into CloudWatch, where you can view it through the GenAI Observability dashboard, providing visibility into your agent’s behavior from high-level metrics down to individual trace details.
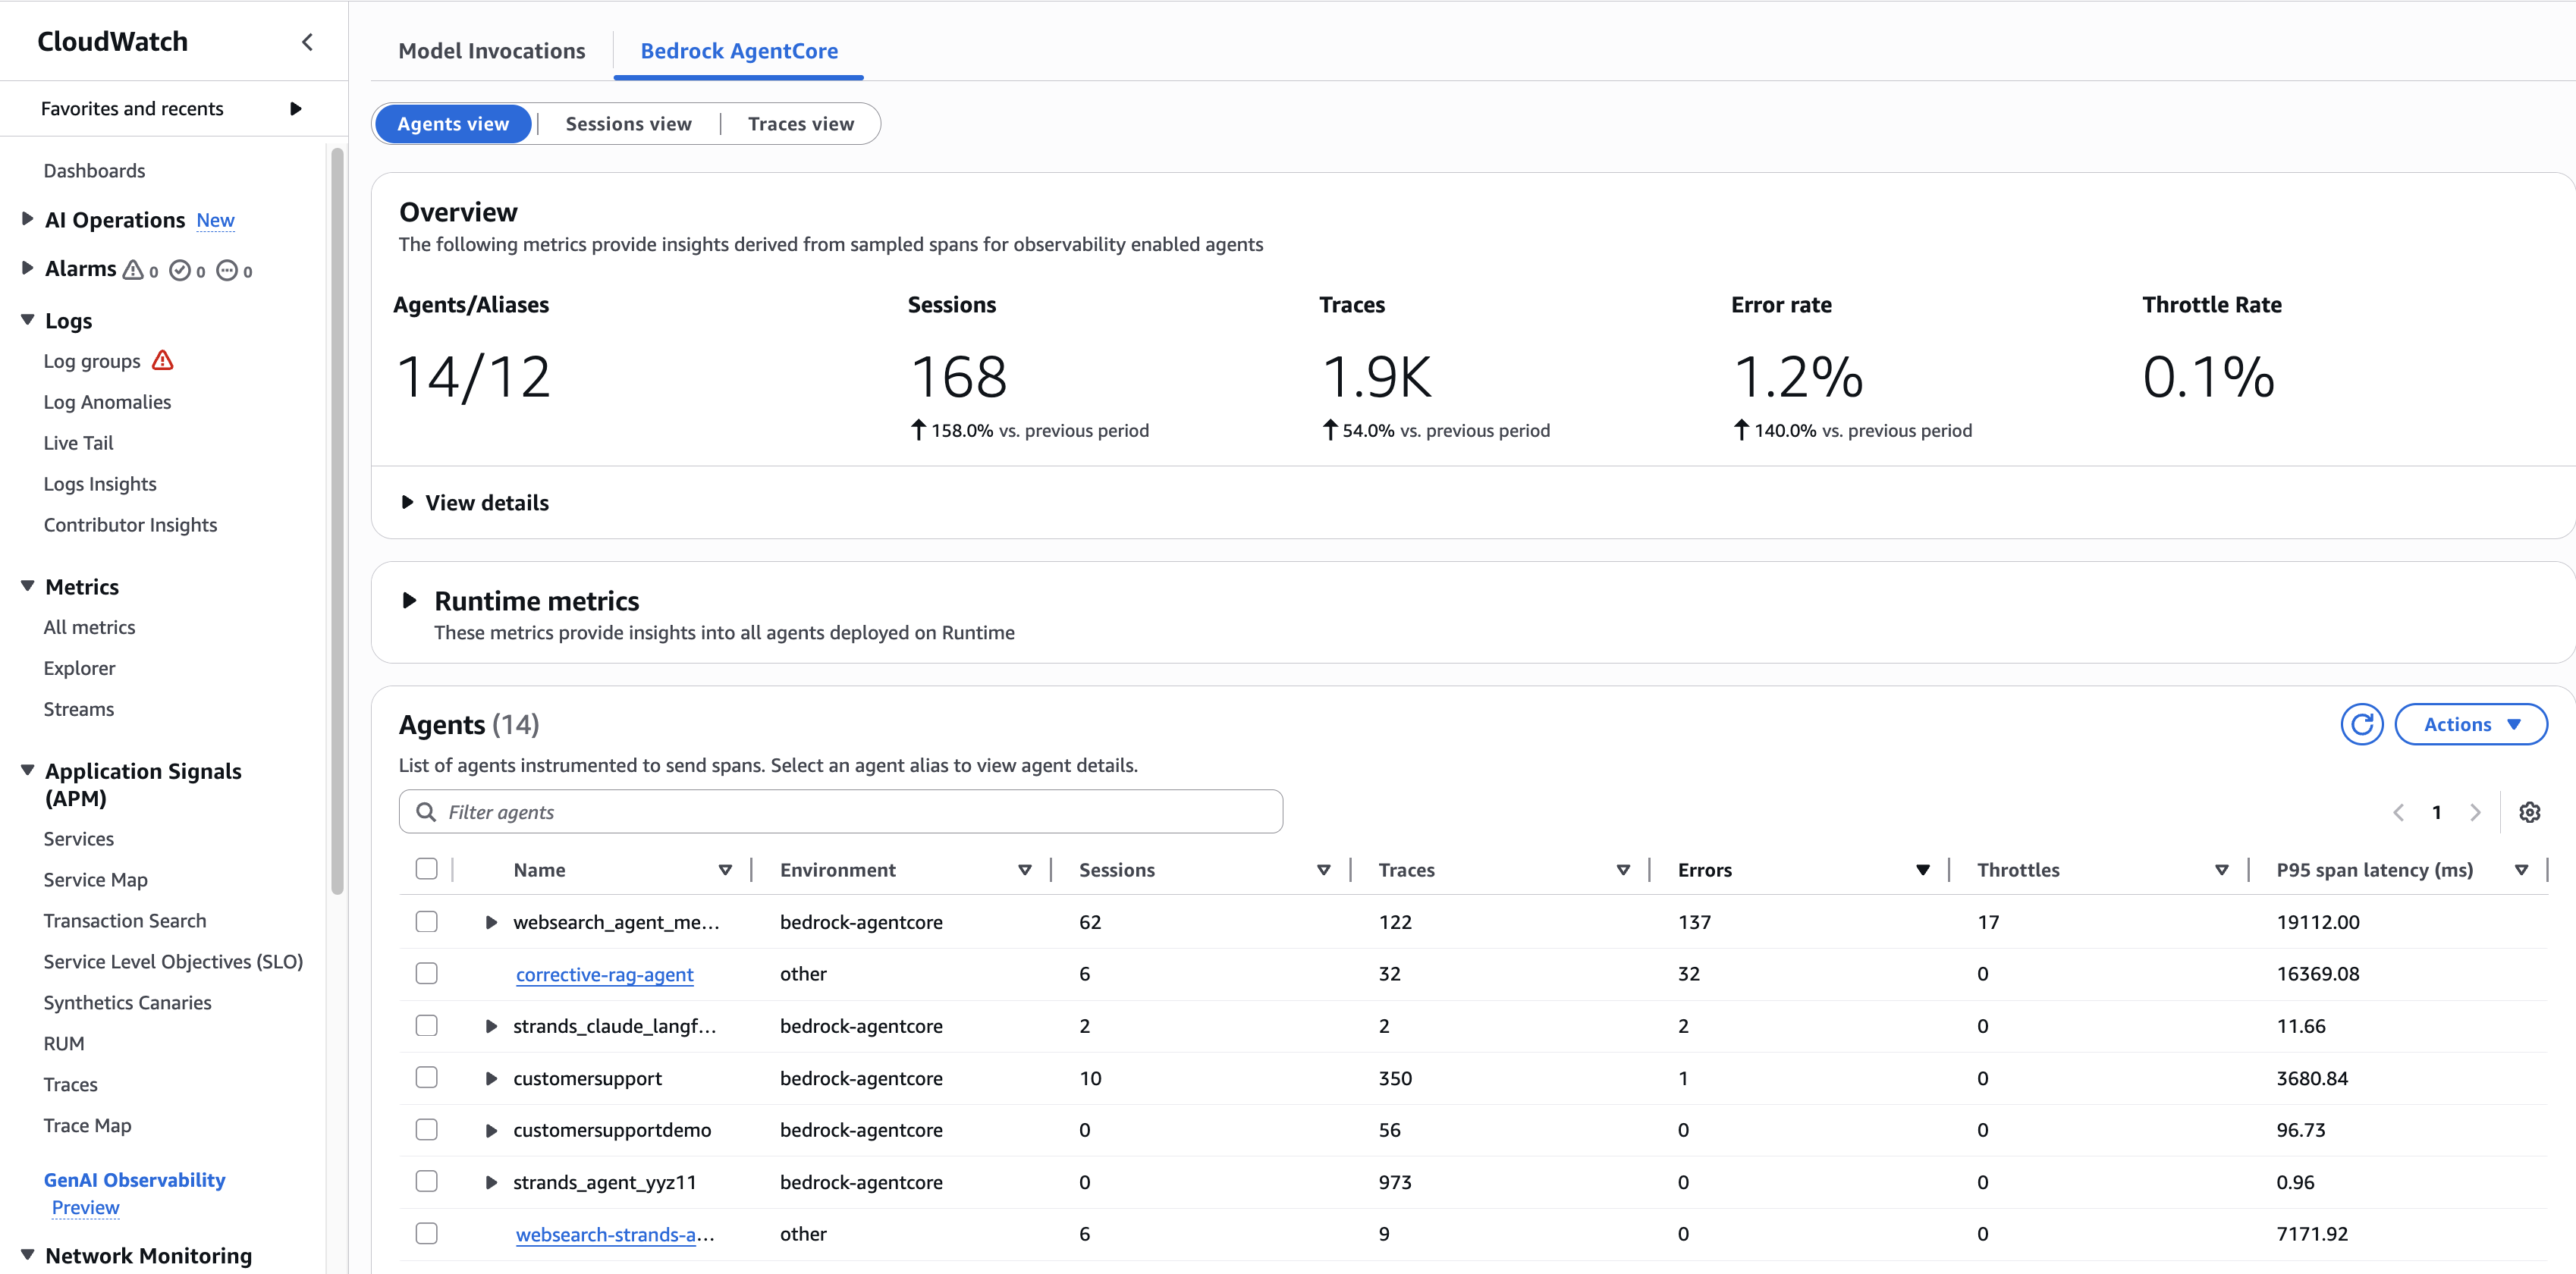
The following screenshot shows the Bedrock AgentCore tab of the GenAI Observability main page, highlighting various data points to monitor your agent’s performance. It showcases the agents, number of sessions, traces, and error rates, which can be filtered based on a custom time frame.
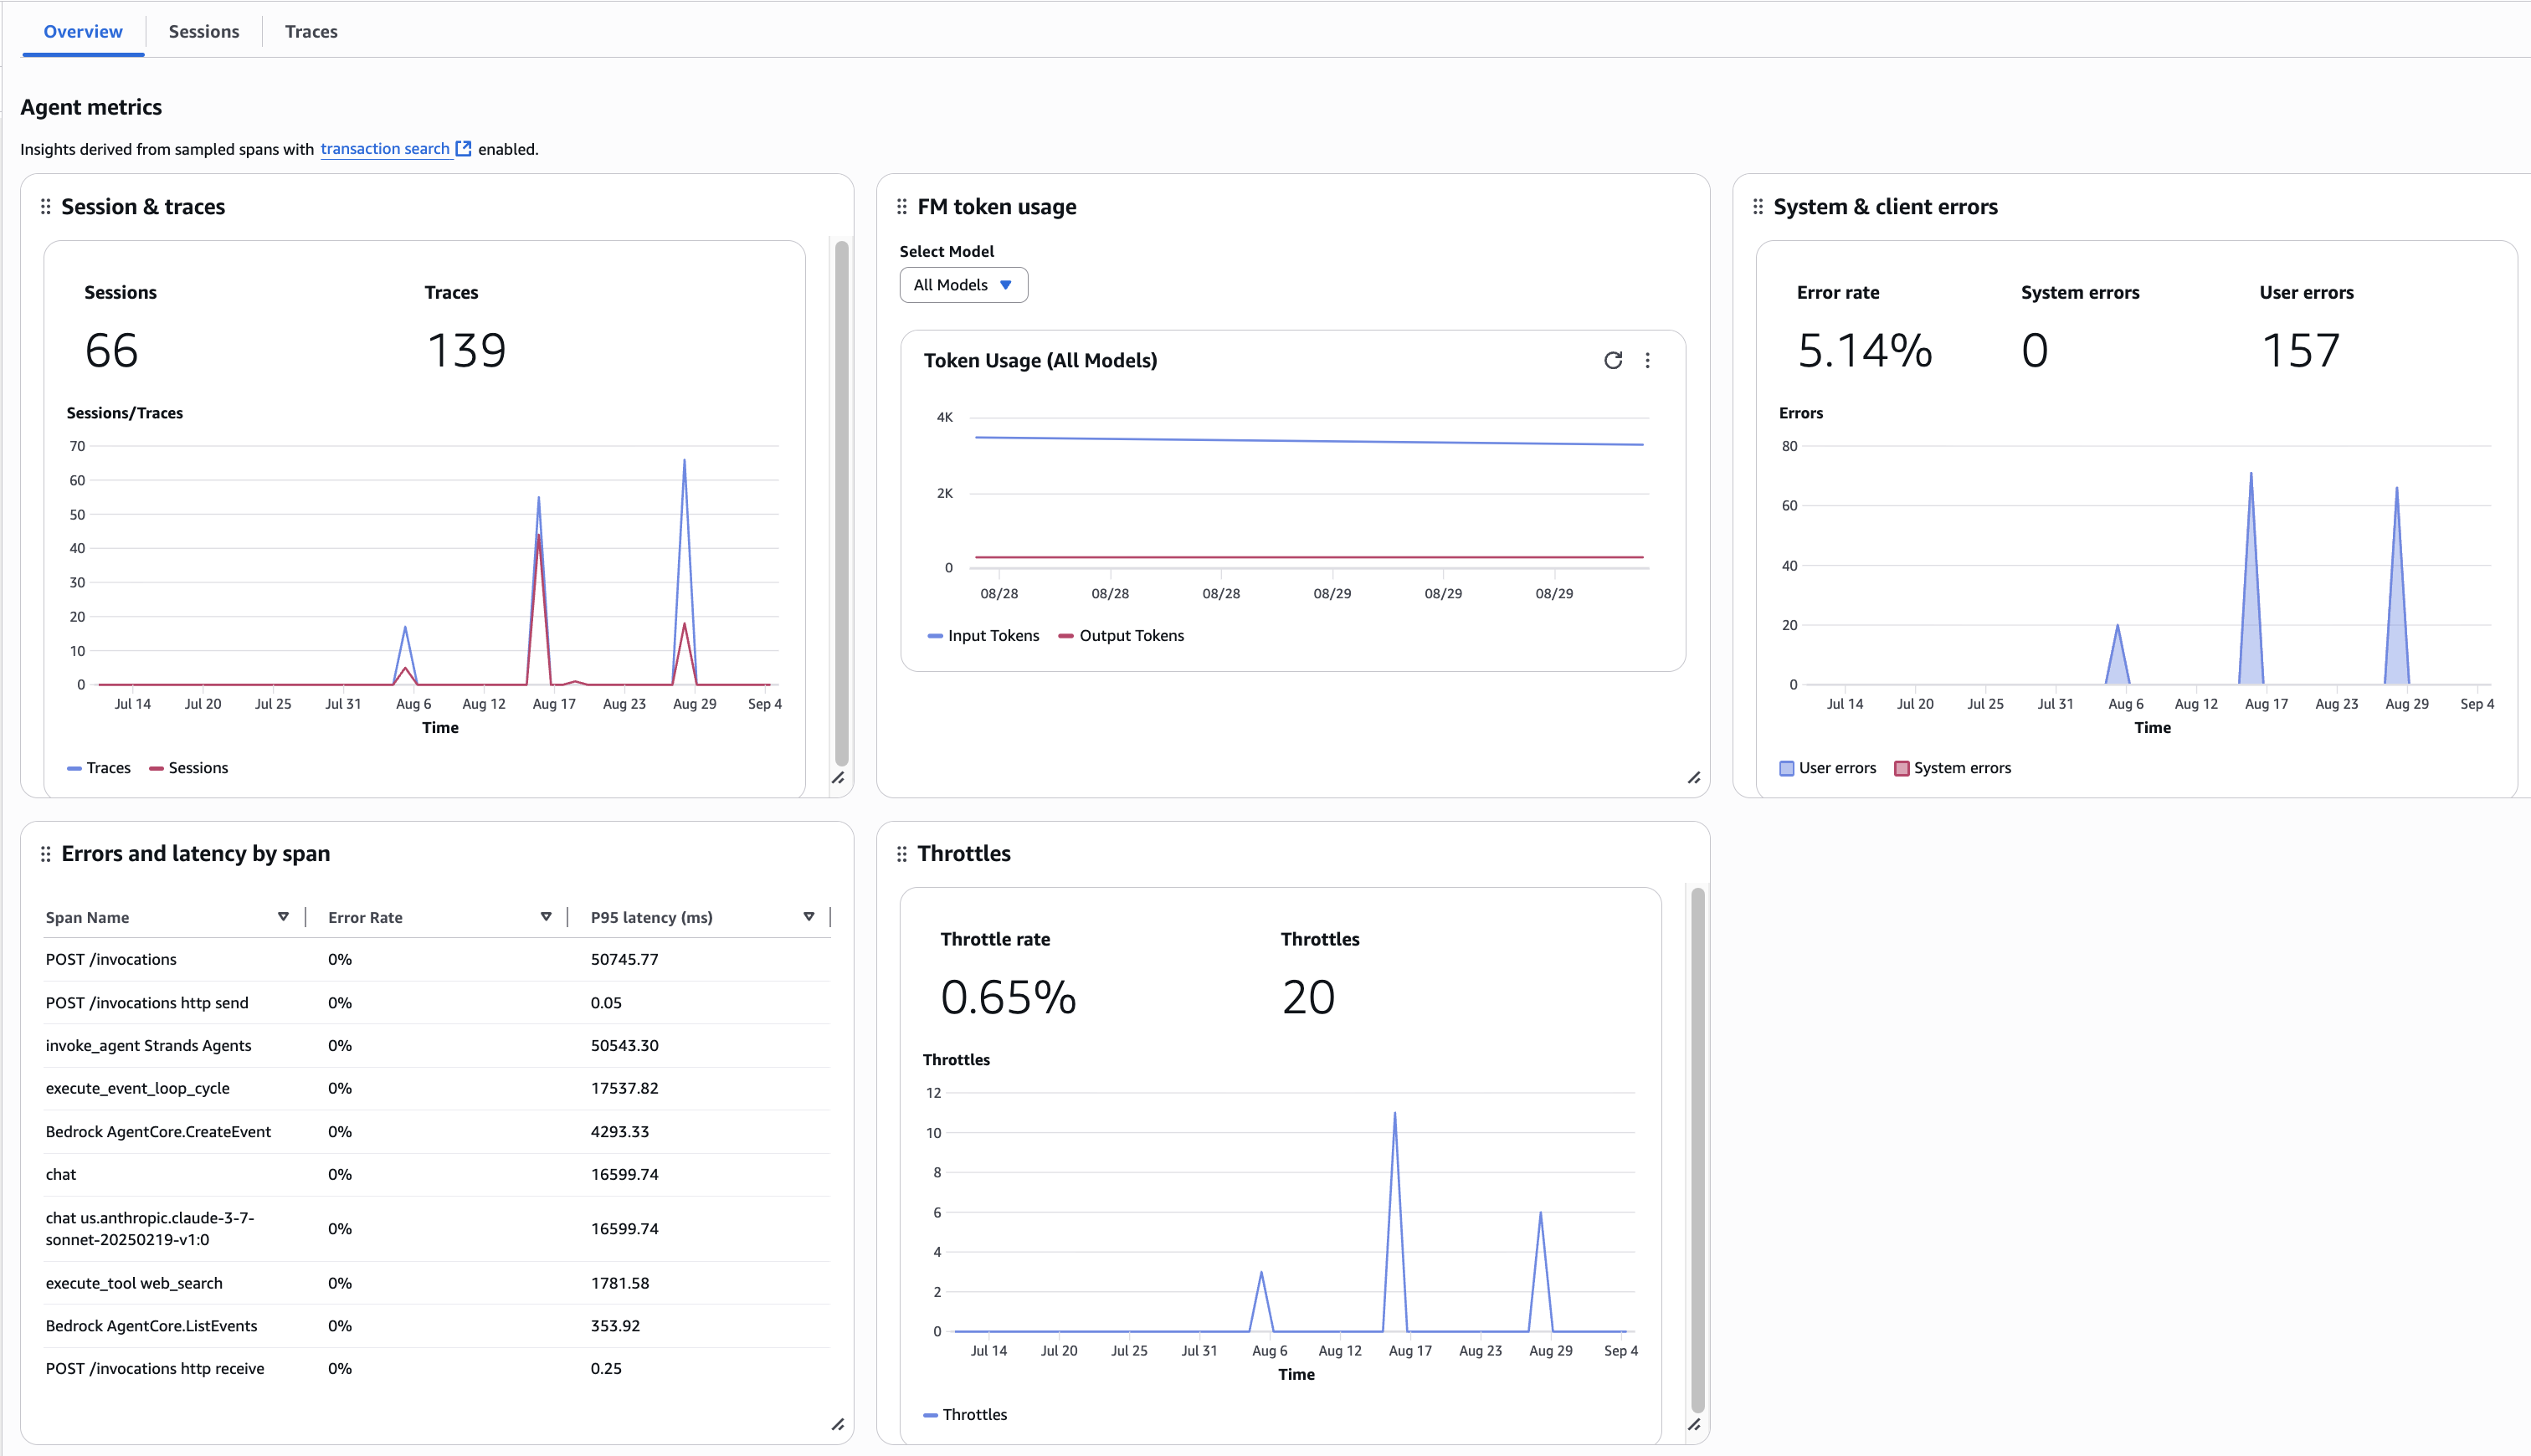
The following screenshot dives into a single agent, highlighting the sessions, traces, latency, errors, and throttles specific to an agent with related visualization graphs.
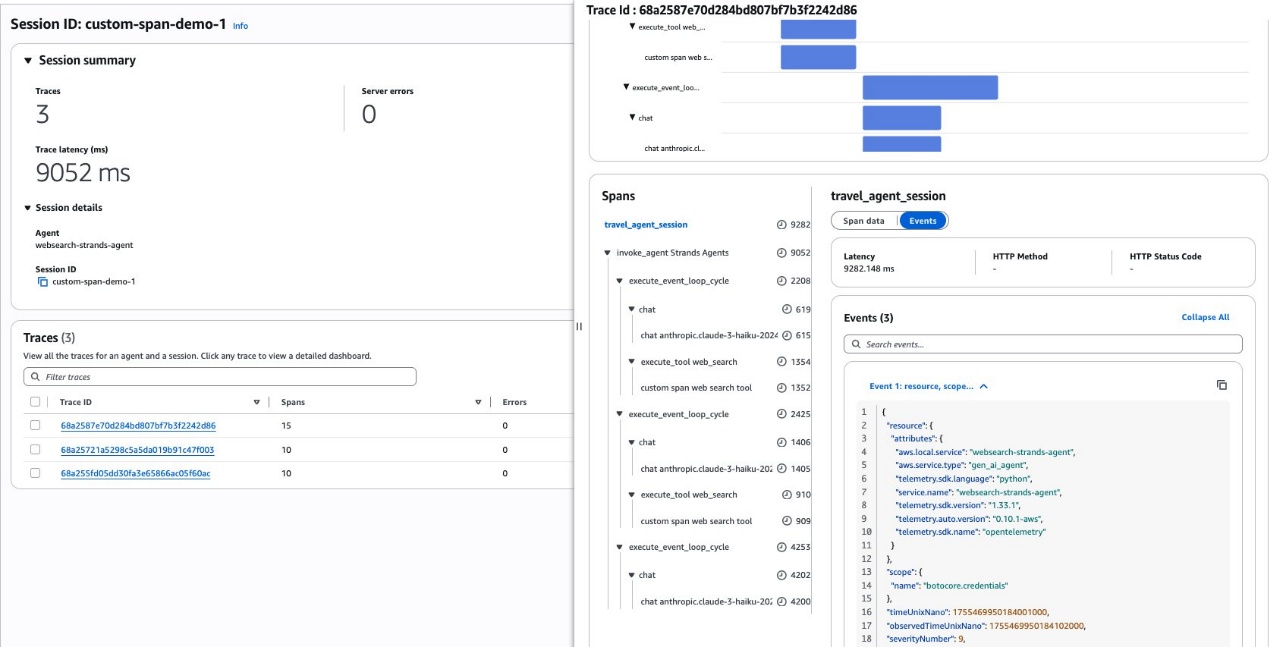
The following screenshot showcases the details displayed when you choose a session ID. You can see the traces associated with a session ID and a session summary view. When you choose one of the trace IDs listed, you will see the trace view with spans, events, and trace timeline with detailed information within each span.
Clean up
Clean up the resources following the steps at the end of the notebook for an agent using Amazon Bedrock AgentCore Runtime. To delete the log groups and log streams created for agents not hosted on Amazon Bedrock AgentCore Runtime, refer to Use DeleteLogGroup with an AWS SDK or CLI.
Best practices
Implementing observability from day one requires thoughtful integration into the development workflow rather than treating it as a separate concern. The most successful AI agent implementations embed observability as a core development practice that enhances both developer productivity and operational reliability. When implementing observability for your AI agents, consider the following key practices to maximize value while minimizing complexity:
- Start simple, then expand – Begin with basic automatic instrumentation before adding custom spans or attributes. The default observability provided by Amazon Bedrock AgentCore captures most critical metrics automatically, including model calls, token usage, and tool execution. Add custom instrumentation incrementally as you identify specific business metrics or operations that need additional visibility.
- Configure for your development stage – Tailor your observability configuration to match your current development phase. During early development, set high verbosity and capture all traces to maximize visibility into agent behavior. For testing environments, reduce logging detail and implement partial sampling to balance visibility with performance. In production, optimize for efficiency with minimal logging and strategic sampling focused on critical paths. This progressive adjustment provides the right level of detail at each stage without unnecessary overhead.
- Use consistent naming – Establish naming conventions for services, spans, and attributes from the start. Group related attributes with prefixes like
agent.for agent properties andbusiness.for use case information. This consistency creates a queryable structure that makes it straightforward to analyze observability data as your implementation grows and make sure monitoring patterns remain coherent across different teams and projects. - Filter sensitive data – Filter out sensitive data from observability attributes and payloads to help minimize the risk of exposing such data. Be especially careful with user inputs, personally identifiable information, and sensitive business data that might appear in agent interactions.
- Review observability data regularly – Make analyzing monitoring data a regular part of your development process, not just something you check when issues arise. Regular reviews help identify optimization opportunities and behavior patterns that can inform your agent design.
Conclusion
Implementing Amazon Bedrock AgentCore Observability from day one transforms how teams develop, debug, and deploy AI agents. By integrating comprehensive monitoring throughout the development lifecycle rather than treating it as a production afterthought, organizations achieve faster development cycles, more reliable agent behavior, and improved operational visibility. The framework-agnostic approach helps your observability investment remain valuable regardless of the technologies you adopt for your agent, providing consistent monitoring capabilities across Strands, CrewAI, LangGraph, or custom implementations.
Start implementing Amazon Bedrock AgentCore Observability today to experience how comprehensive monitoring accelerates your AI agent development journey. Visit Observe your agent applications on Amazon Bedrock AgentCore Observability for comprehensive platform guides and resources to get started. For working examples across different frameworks and implementation approaches, explore the GitHub repository samples that demonstrate how to integrate observability into your specific agent architecture.
About the authors
 Ishan Singh is a Generative AI Data Scientist at Amazon Web Services, where he helps customers build innovative and responsible generative AI solutions and products. With a strong background in AI/ML, Ishan specializes in building Generative AI solutions that drive business value. Outside of work, he enjoys playing volleyball, exploring local bike trails, and spending time with his wife and dog, Beau.
 Gal Goldman is a Senior Software Engineer specializing in agentic AI, cloud architecture, and enterprise AI strategy. He leads development of production AI systems while helping Fortune 100 companies deploy critical workloads at scale. His technical innovations have been featured in industry keynotes and serve millions of users worldwide.
 Madhu Samhitha Vangara is a Specialist Solution Architect at Amazon Web Services, focused on helping customers implement generative AI solutions. She combines her knowledge of large language models with strategic innovation to deliver business value. She has a Master’s in Computer Science from the University of Massachusetts, Amherst and has worked in various industries. Beyond her technical role, Madhu is a trained classical dancer, an art enthusiast, and enjoys exploring national parks.
 Vivek Singh is a Senior Product Manager for GenAI and Agentic Applications at Amazon Web Services, dedicated to democratizing AI agent development and deployment at enterprise scale. He leads product initiatives to address complex AI observability and debugging challenges, enabling developers to build more reliable and efficient autonomous systems. He is passionate about breaking down technical barriers that prevent organizations from successfully adopting AI agents, making sophisticated AI capabilities accessible to development teams worldwide. Outside of work, he enjoys gardening, hiking, and music.
 Yanyan Zhang is a Senior Generative AI Data Scientist at Amazon Web Services, where she has been working on cutting-edge AI/ML technologies as a Generative AI Specialist, helping customers use generative AI to achieve their desired outcomes. Yanyan graduated from Texas A&M University with a PhD in Electrical Engineering. Outside of work, she loves traveling, working out, and exploring new things.


